Know everything about high-resolution oceanographic data available within TZ Professional
The high-resolution oceanographic data available with the new premium oceanographic service of TZ Professional are the key factors in targeted fishing for an optimal performance. Decide the data that best affects your type of fishing, combine them and visualize the best fishing spots. Read through the details below to master the data that will take your activity to the next level.
Check out every oceanographic data integration into TZ Professional
| Data | Source | Resolution | Depth | Forecast | Download |
|---|---|---|---|---|---|
| Altimetry (SSH) | Copernicus | High resolution: 0.08° (8Km) | Surface | 10 days | Daily |
| Currents | Copernicus | High resolution: 0.08° (8Km) | 0 to 1000 m (30 layers) | 10 days | Daily |
| SWT | Copernicus | High resolution: 0.08° (8Km) | 0 to 1000 m (30 layers) | 10 days | Daily |
| Salinity | Copernicus | High resolution: 0.08° (8Km) | 0 to 1000 m (30 layers) | 10 days | Daily |
| Thermocline | MaxSea | High resolution: 0.08° (8Km) | Top of the Thermocline Depth | 10 days | Daily |
| Cloud Free SST | Nasa JPL | Very high resolution: 1Km | Surface | Near Real Time Observation | Daily |
| SST | NOAA | Very high resolution: 2Km | Surface | Near Real Time Observation | Daily |
| Cloud Free Chlorophyll | Copernicus | High resolution: 0.04° (4Km) | Surface | Near Real Time Observation | Daily |
| Phytoplankton | Copernicus | Low resolution: 0.25° (25Km) | Surface | 7 days | Weekly (Thursday) |
| Primary production | Copernicus | Low resolution: 0.25° (25Km) | Surface | 7 days | Weekly (Thursday) |
| Dissolved Oxygen | Copernicus | Low resolution: 0.25° (25Km) | 0 to 1000 m (30 layers) | 7 days | Weekly (Thursday) |
| Shear | MaxSea | High resolution: 0.08° (8Km) | Max Shear Depth | 10 days | Daily |
| Sea Ice | Copernicus | High resolution: 0.08° (8Km) | Surface | 10 days | Daily |
| Sea Water PH | Copernicus | Low resolution: 0.25° (25Km) | 0 to 1000 m (30 layers) | 7 days | Weekly (Thursday) |
| FSLE | MaxSea | Very high resolution: 3Km | Surface | 1 day | Daily |
Definition
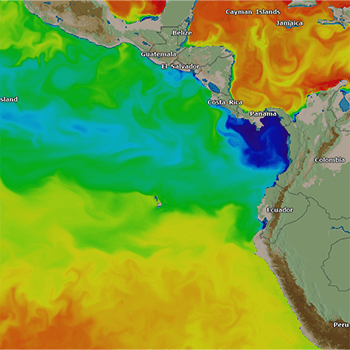
The seas and oceans are not flat. Water levels vary (maximum -2m/+2m) depending on the temperature of the water. Cold waters are denser than warm waters. Altimetry measures this difference between Mean Sea Level (average level of the surface of Earth's oceans) and current observed sea level.
Altimetry is also referred to as Sea Surface Height (SSH) or Sea Surface Anomaly.
Data interpretation and interest for fishing
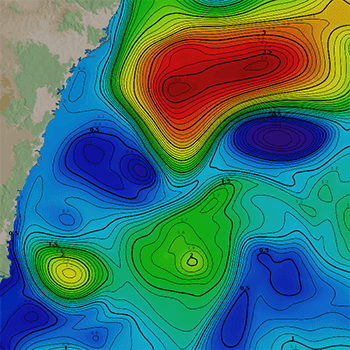
Positive altimetry indicates bumps (SSH>0m) showing areas where the water column is warmer (expand). Conversely, negative altimetry indicates holes (SSH<0m) showing areas where the water column is colder (denser) and where deep cold waters rise to the surface. Overall, water tends to be colder where SSH<0, and warmer where SSH>0.
Pelagic species generally prefer to stay in warm waters, but nutrients are usually found in cold waters.
- SSH<0m is where nutrients plankton tend to concentrate
- SSH>0m is a comfort zone for some fish like Tuna
Consequently, these species favor the SSH frontal zones. They go to cold waters with negative altimetry to feed and then return to warmer areas with positive altimetry to warm up. That is why it is important to identify SSH fronts (near SSH=0m) in your fishing area.
Note: difference of sea levels observed in altimetry generates currents (just like difference in pressure generate wind). When comparing SSH and currents in TZ Professional, it is easy to see the relationship.
Definition
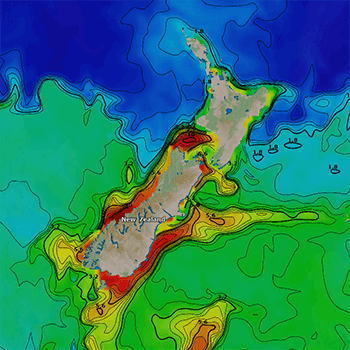
Shear data show the variations in strength of currents from one depth to the other. It is the result of combining Shear Depth and Shear Strength. Shear Depth being the depth at which the shear occurs and Shear Strength indicating if the variation of currents is strong or weak.
Data interpretation and interest for fishing
Shear highlights areas that present a risk of damage to your net. Areas where shear is strong AND that have a depth corresponding to the path of your net can be harmful.
A shear depth of 350m is not significant (not dangerous) if you are using a sein of 50 meters of height. However, if currents go in one direction at the surface but in another direction at a depth of 20 meters, there is a risk of damaging your net (or other fishing gear).
Protect your net by predicting shear areas in your fishing zone! TIMEZERO automatically identifies and display dangerous areas that can damage your fishing net by combining Shear Depth and Shear Strength values.
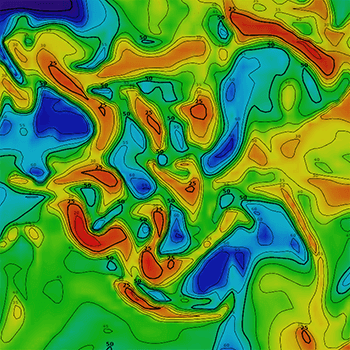
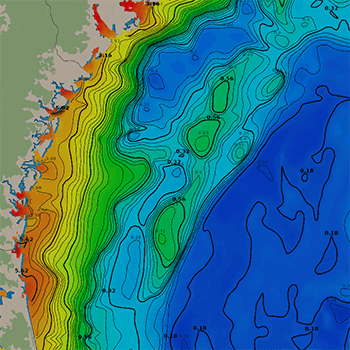
Definition
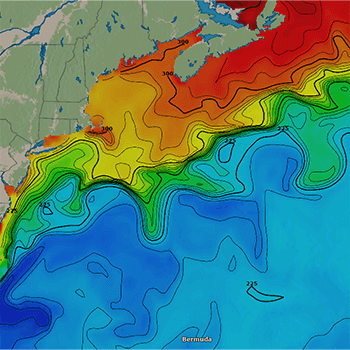
Theoretically, when diving from surface to deep sea, water temperature decreases slowly. However, there may be a certain depth where water temperature variations are significant, this zone is called thermocline. The thermocline is a boundary between deep cold waters and warmer surface waters.
Thermocline is the result of combining Thermocline depth and Thermocline strength. TZ Professional uses a unique calculation algorithm to display thermocline information.
Please note that there are 3 types of thermocline but TIMEZERO only displays the Seasonal type (between 50 and 300m) since it is the most interesting for fishermen. Indeed, the Diurne thermocline (between 0 and 10m) is not stable enough to target fishing spots and the Permanent thermocline (between 500m to 1000m) does not impact fishing.
Data interpretation and interest for fishing
Thermocline depth is the highest depth of the fish’s living area. Thermocline strength shows how quickly the water temperature changes at thermocline depth; in other words, how strong the thermocline is. TIMEZERO thermocline algorithm does not tell at which depth to fish; instead it gives an indication of "capturability".
A thermocline close to 0 means that there is no thermocline; water temperature decreases regularly from surface to deep sea. In case of weak thermocline, fish like Tuna have no depth limit when they dive. On the other hand, a high thermocline strength value means that thermocline is very clear and sensitive; It will act as a horizontal wall that the fish cannot cross.
To sum up, the thermocline acts as a barrier and varies with depth. If your seine goes down to 150m of depth and the thermocline is at 200m, the fish can escape through the bottom; whereas if the thermocline is at 125m they will be blocked by this natural obstacle and will remain in your net.
Targeting the right thermocline depth, ranging from the surface (0m) to the net height (for example 50m) combined with a strong value (Thermocline strength) will instantly highlight the best fishing areas.
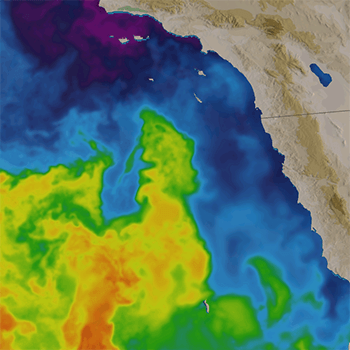
Definition
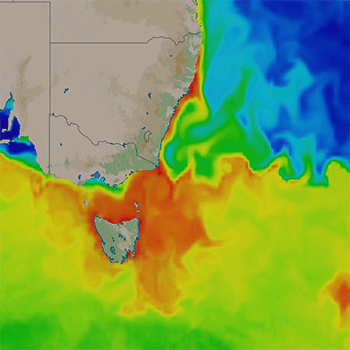
Sea Surface Temperature (SST) data are only for surface while Sea Water Temperature (SWT) data have several depth layers and make it possible to check water temperature in deep waters.
SST is extremely precise real-time data while SWT is computed from models offering up to 10 days of forecast. Because SST is derived from satellite observation it is affected by clouds. In TIMEZERO, the SST data is enriched with data computed from models including various sensors such as water temperature measured by vessels or buoys. Combining both SST and SWT is useful in order to achieve the highest level of accuracy.
There are 4 levels of quality for SST data: from L1 to L4. L1 is raw data coming from satellite sensors; L2, L3, L4 are different levels of quality and more refined.
Nasa JPL SST is a Global Observation gap free product (L4) merging SST data from satellites with different resolutions from 1Km to 25Km resulting in an artificial 1Km Resolution.
NOAA SST is a Global Observation Product with gaps due to cloud (L3) but with a 2Km real resolution that allows to accurately identify SST fronts on very small scales.
Data interpretation and interest for fishing
Various scientific studies have shown that every fish species has a respective comfort temperature. Water temperature helps you find the areas suitable for the specific fish species you are capturing. For example, we know that albacore tuna is generally found in waters between 15 ° C and 21 ° C.
By displaying SWT along with depth, you can define with extreme precision the area that fish dive to.
Another powerful data display shows the temperature fronts where the temperature varies quickly. Such fronts act like a barrier, or a wall, for fish that tend to concentrate there. They try to get around these fronts and move along them.
The temperature data filters available in TZ Professional are probably the easiest to use but also the most powerful available to date.
Note: SWT can be used as surface data, but will have poor accuracy, that’s why for surface it is better to use SST.
Definition
Salinity is the salt concentration in sea water. One unit of salinity is PSU (Practical Salinity Unit), it is equal to 1 gram of salt per kilogram of water.
Data interpretation and interest for fishing
Fish body tissues contain less salt than the water in which they live. Fish regulate their salt concentration through osmoregulation which is different from one fish species to another. That is why each Fish species has its own salinity comfort zone.
Targeting the right salinity values by using TZ Professional filters allows you to display the best fishing areas with just one click.
Salinity is linked to Oxygen: The more salt there is, the less oxygen there will be.
Definition
Oxygen is the O2 concentration in sea water.
Data interpretation and interest for fishing
Oxygen is useful as complementary data for salinity in highlighting the specific comfort zone for every fish species according to their osmoregulation. The more oxygen there is, the less salt there will be.
Salinity is high resolution data for local areas while oxygen data show the tendencies on a larger scale (ocean scale). That is why combining both is useful to achieve the highest level of accuracy.
Definition
Phytoplankton are a single celled microorganism, with ability of photosynthesis, that drift about in water. They are primary producers and the foundation of the marine food chain, and that is why they have an indirect impact on fish location.
Microscopic phytoplankton play one of the biggest roles in oxygen supply and food production.
Data interpretation and interest for fishing
Phytoplankton data is useful to display significant trends that can be correlated with specific fish species concentration. Playing with Delta filters in TZ Professional allows for the finding of phytoplankton fronts (big variations).
Definition
Primary production is the synthesis of organic material generated by phytoplankton and forming the base of the marine food chain. That is why they have an indirect impact on fish location.
Data interpretation and interest for fishing
Primary production is a consequence of phytoplankton activity, observing the “delta” data helps finding the most significant fronts (big variations). In the same way as phytoplankton data, primary production is useful to display outstanding trends that can be correlated with specific fish species concentration.
Definition
Chlorophyll is a color pigment found in plants, algae and phytoplankton. When Chlorophyll concentration is high, water gets green and less translucid, that is why you may find this data named “Sea color”.
There are 4 levels of quality for CHL data: from L1 to L4. L1 is raw data coming from satellite sensors; L2, L3, L4 are different levels of quality and more refined. TIMEZERO CHL Data is Level 4.
Note: Chlorophyll is directly detected by satellite sensors, while phytoplankton & primary production are computed by models (partially deduced from Chlorophyll data).
Data interpretation and interest for fishing
Chlorophyll is commonly used because of the well-known correlation between chlorophyll concentration and fish location.
Small fish like to stay in highly concentrated chlorophyll area, because this is where food (microorganisms) is.
Bigger fish favor the chlorophyll frontal zones. In the morning, they go to highly concentrated chlorophyll areas to hunt small fish and then return to their comfort zone in low-chlorophyll areas for better visibility (safer), and more oxygen. They cross the edge of chlorophyll areas twice a day.
That is why it is important to identify chlorophyll fronts in your fishing area by displaying the chlorophyll Delta.
Definition
Currents are horizontal speed and direction of water movement. This is multilayer data since current speed and direction might vary depending on depth.
Data interpretation and interest for fishing
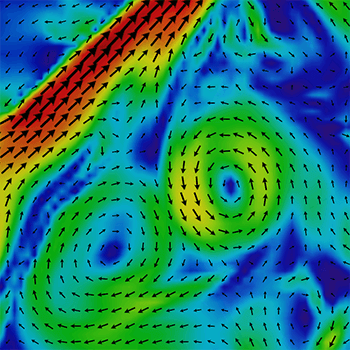
Areas with moderate currents are of great interest since they prevent from stagnating waters and turbulent areas.
There can be significant variations between surface currents and deeper area currents. This has an impact on fish location. That is why playing with currents data filters in TZ Professional is so valuable. It allows you to display the currents only for the particular depth in which specific fish species you are capturing.
Definition
Sea ice forms when seawater freezes, creating icy layers on the ocean surface. Key parameters include:
- Concentration: How much of the surface is covered by ice.
- Thickness: How deep the ice layer is.
- Drift Velocity: How fast and in which direction the ice moves.
Data interpretation and interest for fishing
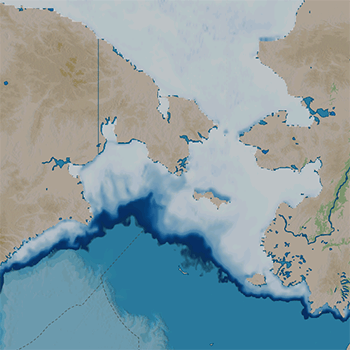
For safety, avoid areas with significant ice concentration, as it can block navigation and damage vessels. Thick ice is hazardous for movement, while fast ice drift increases the risk of collisions or trapping vessels. Always prioritize areas with manageable ice conditions.
Definition
Sea water pH measures the acidity or alkalinity of seawater on a scale from 0 to 14, with 7 being neutral. Values below 7 indicate acidic water, while values above 7 indicate alkaline water. pH levels in the ocean are influenced by factors such as carbon dioxide levels, temperature, and marine life.
Data interpretation and interest for fishing
- Low pH (Acidic water): Low pH (below 7.5) can harm marine life, including fish species, corals, and shellfish. Acidic conditions can affect fish behavior and growth.
- Optimal pH (Near neutral to slightly alkaline): pH between 7.5–8.5 is ideal for most marine species and promotes healthy fish populations.
- High pH (Alkaline water): Extremely high pH (above 8.5) can stress marine life, reducing fish availability and disrupting feeding patterns.
Fishing Tip: Stable, slightly alkaline water is best for fishing. Avoid areas with low or extremely high pH, as they can negatively affect fish populations and fishing success.
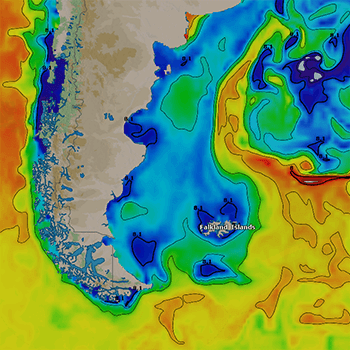
Definition
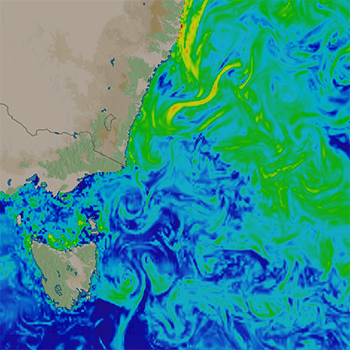
FSLE (Finite-Size Lyapunov Exponents) highlights oceanic fronts where water masses “stretching” or “convergence” occurs. It provides insights into dynamic behaviors by analyzing six months of historical geostrophic current data updated daily with a 3 km resolution. FSLE data is not affected by cloud cover.
Data interpretation and interest for fishing
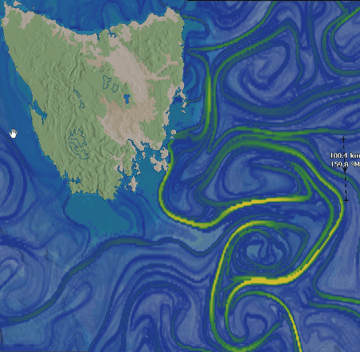
- FSLE data helps detect oceanic fronts that are aggregation zones for plankton and small fish, attracting the predators (tuna, swordfish, mackerel, etc.). FSLE can be combined with other data:
- Sea Surface Temperature (SST): FSLE fronts near temperature changes are often highly productive.
- Chlorophyll: FSLE fronts at the edges of plankton-rich zones are key transit points for predators.
- TZ MAPS BathyVision: helps identify areas where FSLE convergence overlaps with bathymetric drop-offs, creating nutrient-rich zones full of marine life.
FSLE is revolutionizing fishing, helping you find the best catch spots with greater accuracy. Access the full information to master all its potential in the FSLE dedicated page.
Access to the most powerful technology in the world
All the above high-resolution oceanographic data are available with the new premium oceanography service of TZ Professional. Display in one click all areas with optimal conditions specific to your type of fishing. No need to become an oceanographer to use our forecasts. TZ Professional instantly displays the recommended areas!