The Characteristics of Sedimentary Charts
Ideal for commercial fishermen and sport fishing, but equally to scientists, sedimentological charts provide seafloor classification on the following criteria: the type of seafloor surface (rock, gravel, sand, mud) and the density of the material.
Official charts are provided by specialized organizations such as IFREMER. Also by connecting to specialized Furuno sounders, TIMEZERO displays the data and information in precise and detailled fashion directly on your screen, to create your own sedimentological chart.
Customized Sedimentological charts in TIMEZERO
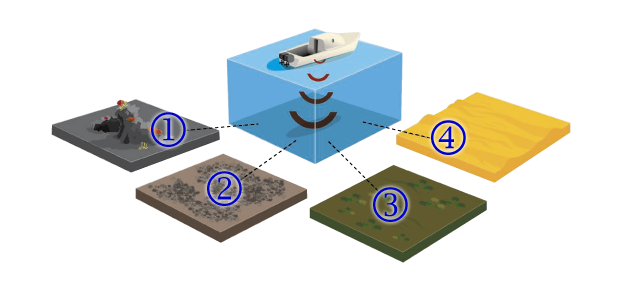
Legend: 1 Rock 2 Gravel 3 Mud 4 Sand
It is designed mainly for commercial fishermen, but also for scientific purposes as well as for recreational use. Using the information of the sedimentology and the density of the sedimentary rock, you can get valuable insights and save time and money on not going to a location that has low probability of catch.
The data available in the charts has been collected by the French Institute of Research for Sea Exploitation IFREMER and the Marine Oceanographic Hydrographic Service SHOM.
Identifying the Seafloor Structure
An alternative to these Sedimentology Charts which are limited to certain areas in the North Atlantic and the Mediterranean is picking up a Furuno Sounder (BBDS1 and DFF1-UHD) which can be directly set up with TIMEZERO software to receive information of the depths and the bottom discrimination.
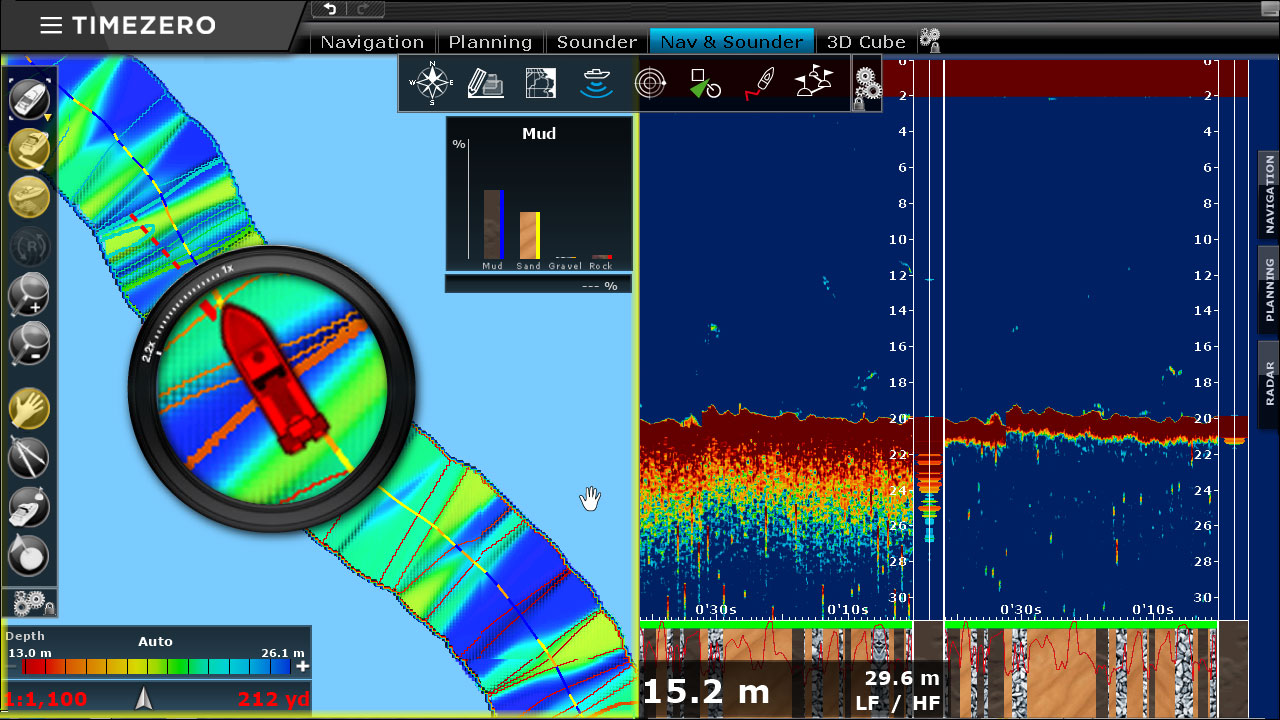
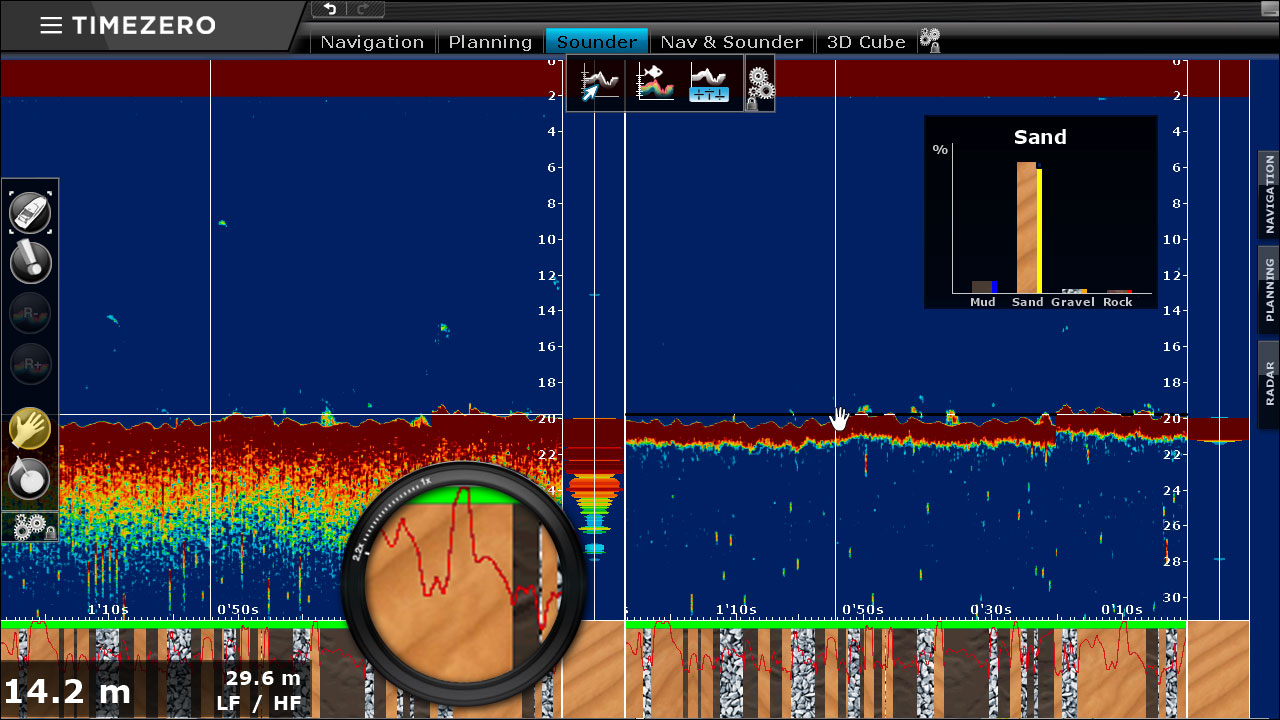
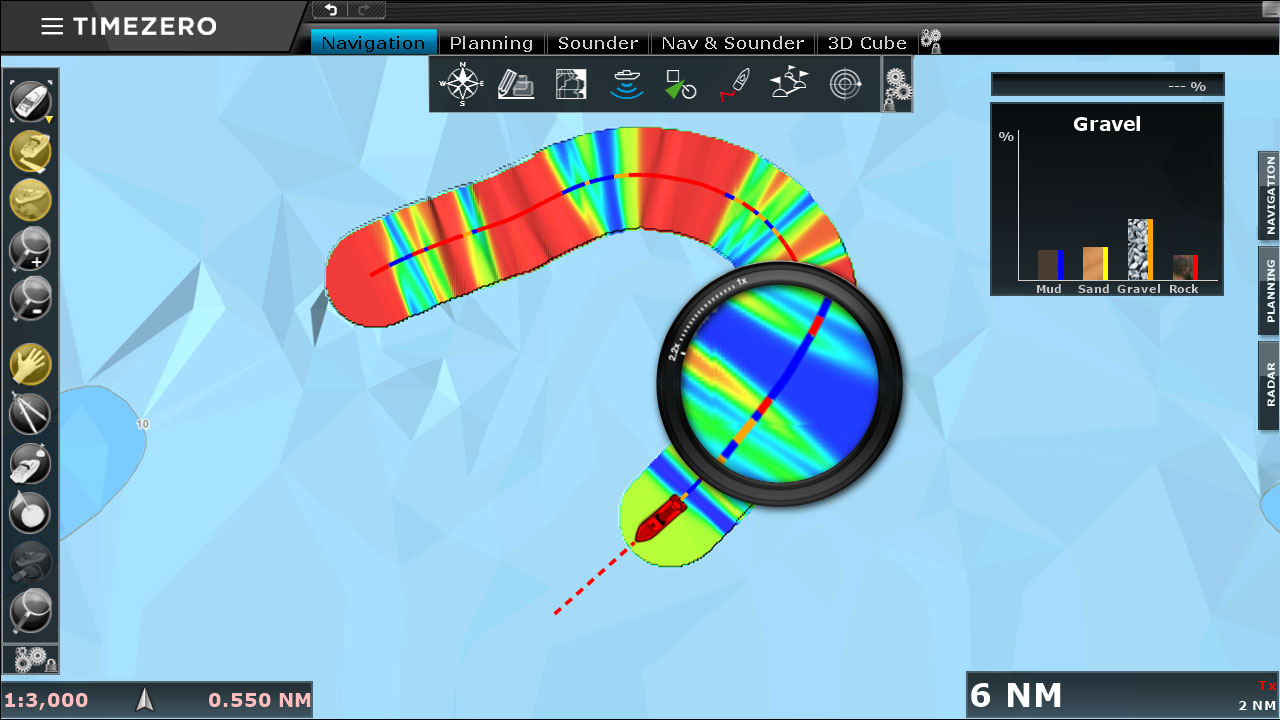
The sounders determine the seafloor structure and classification into the following categories: rock, gravel, sand and mud. This is possible by analyzing the characteristics of the echo in comparison with the characteristic of each category such as their unique size/density. TIMEZERO can then display the identified seafloor sediment in that location.
In addition to provide the seafloor discrimination, the Furuno sounders BBDS1 and DFF1-UHD go one step further by providing the degree of reliability of the received data. A probability curve displays the reliability of the analyzed component.
TIMEZERO can display the discrimination of the seafloor through the color code of the trace. The colors used in the color code are the same as you will find in your Furuno equipment.
All the data on the seafloor combined within a single tool
Defining the Seafloor Density
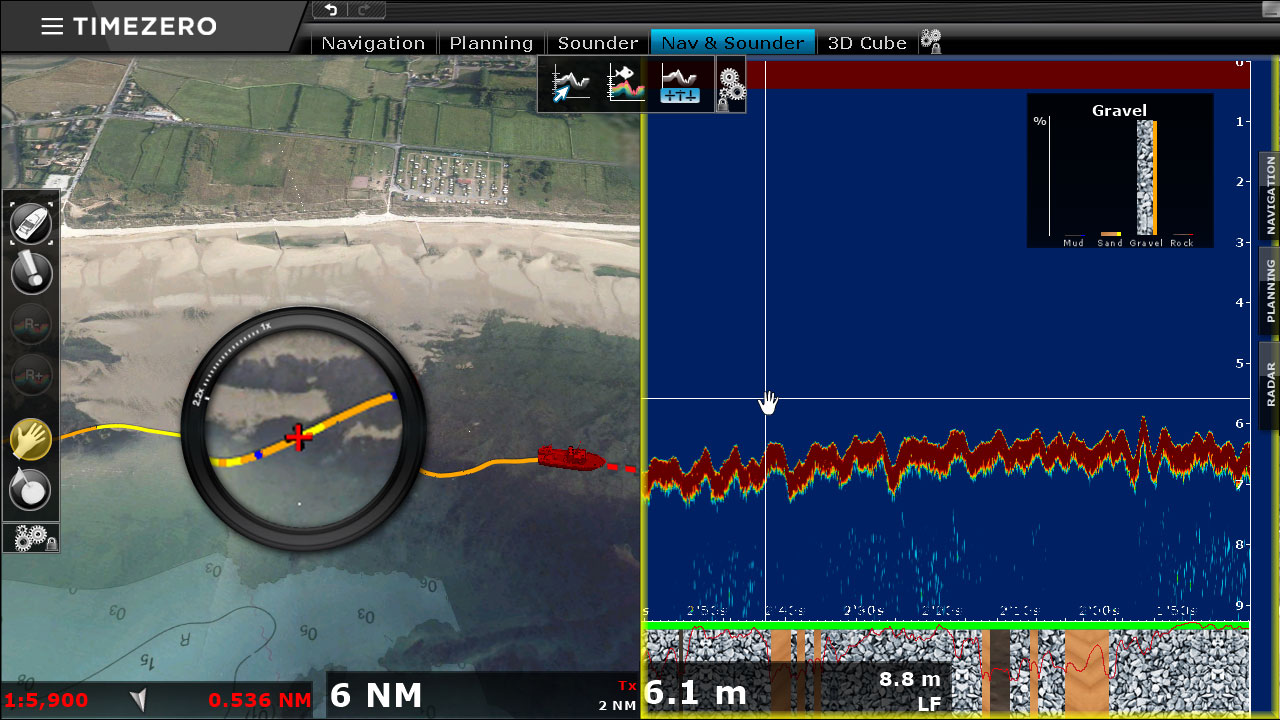
Thanks to the PBG module, TIMEZERO can display the discrimination as well as the density using a color scale directly on the chart.
TIMEZERO saves the seafloor density in real time by taking the information that is received from the sounder and displaying this on the chart using a color scale. The information from the density can also be provided if the sounder provides a depth.
It is possible to display the density of the seafloor directly on the chart with a color scale: From the softest density (mud) to the the most dense (rock). You can also choose a grey-scale.
Allows to adjust the overall "width" of PBG tracks (even when set to dynamic).